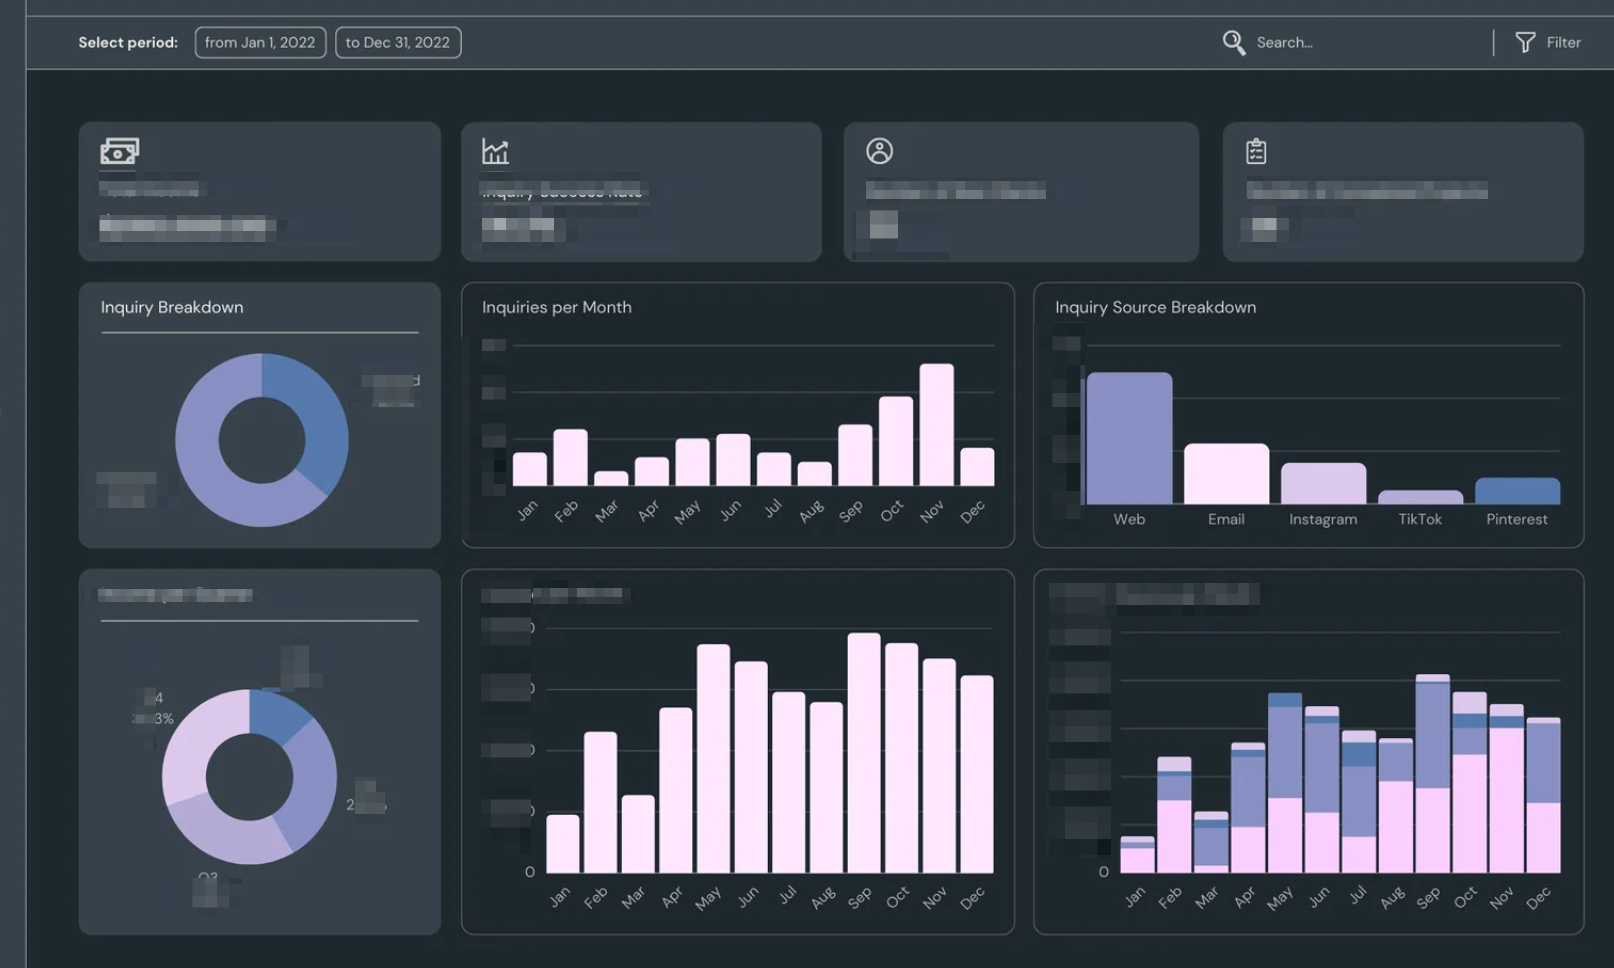
The myIO project provides common chart types rendered in modern browsers using d3.js and extended in the R programming language for a fully open sourced software library.
Some of the features include popovers to communicate data, PNG download, CSV data download, and build in legend filters.

The library also includes more modern versions of data visualizations that are less typical but can support a variety of business needs – particularly for highly nested data. Below is an example of a treemap chart that creates rectangles representing the total count of car types, nested within within color coded groups according to the number of carburetors (a toy example to demonstrate).

-Ryan Morton


